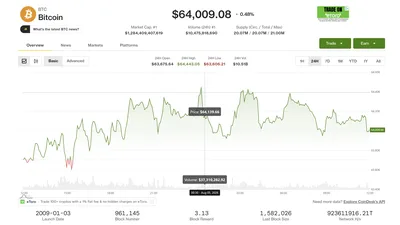
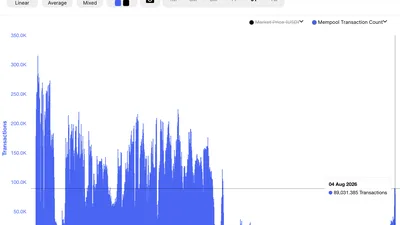
Bitcoin Metrics Signal Longest Capitulation Since FTX Collapse
Glassnode data shows Bitcoin's aggregate price cycle tool has entered its coldest phase since the FTX implosion in late 2022.
A closely watched basket of Bitcoin price metrics has fallen into its most prolonged capitulation phase since the collapse of the FTX exchange in November 2022, according to new data from on-chain analytics firm Glassnode. The finding underscores how deeply the recent downturn has weighed on market sentiment, with multiple cycle indicators deteriorating simultaneously rather than in isolation.
Glassnode's aggregate BTC price cycle tool combines a range of on-chain and market-structure signals to produce a composite read on where Bitcoin sits within its broader boom-and-bust patterns. When that composite reading descends into what the firm calls its "coldest" phase, it typically reflects widespread unrealized losses, weakening demand, and a broader retreat among short-term holders — conditions that historically precede periods of accumulation ahead of eventual recoveries.
Read more Check-Cap Sets Eight-Week Timeline for MBody AI Merger Close →
The FTX comparison carries significant weight. The implosion of Sam Bankman-Fried's exchange in late 2022 triggered one of the most severe confidence crises in crypto's history, wiping out tens of billions in market value and driving Bitcoin to multi-year lows near $15,500. The fact that current conditions rival that episode in duration — if not necessarily in magnitude — suggests this cycle's correction has been more grinding and persistent than many participants anticipated.
For longer-term investors, prolonged capitulation readings have historically served as a contrarian signal, marking zones where patient buyers have found attractive entry points. That said, capitulation phases can extend further than expected, and on-chain data alone does not guarantee a timing bottom. Macro variables, including interest rate policy and institutional demand flows, continue to shape Bitcoin's near-term trajectory alongside purely technical cycle metrics.
Continue reading at Cointelegraph.